
When we left off, you were just beginning to wonder “When will my organization be the victim of a significant cyber incident?”
And I told you I would show you how cyber risk intelligence could help us get there. So here goes.
It is the job of the cyber risk intelligence analyst to place all cyber events affecting the organization he serves on the Boom Chart:
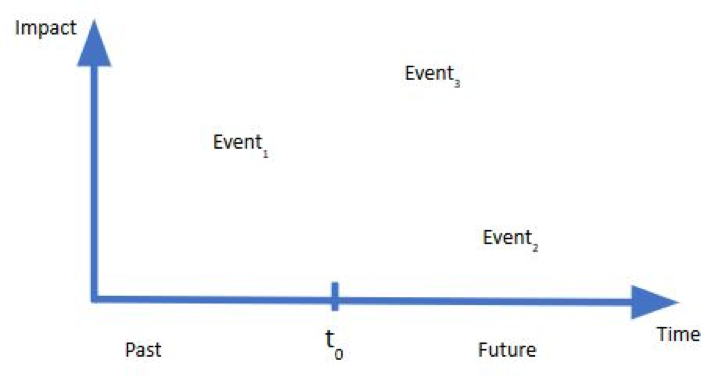
The Boom Chart is a conceptual tool the analysts uses to estimate when things go “boom”, and how big the boom will be. The Y axis displays “Impact”, the X axis displays “Time”.
T sub not (t0), shown on the X axis, represents the present. The cyber intelligence analyst deals always in the notion of time. He must cover both events that have already affected the organization (shown to the left of t0), and events that may affect the organization in the future (shown to the right of t0).
Intelligence analysts often do not learn about events that have impacted their organization until after the event has occurred. The “dwell time” statistic made famous by Mandiant’s annual “M-Trends” reports illustrates this concept nicely (see Mandiant metrics white paper for more detailed discussion about dwell time and its components). We all kind of naturally find ourselves wanting to “get that dwell time down”.
Indeed, a cyber intelligence analyst provides the most value to his organization when leadership trusts him to deliver an accurate appraisal of events that will occur in the future — eliminating dwell time all together. While important caveats exist, logic dictates that event impacts can be mitigated or diminished less-expensively and more-effectively before the event occurs than they can afterwards.
Next time, we will discuss some specific ways an analyst goes about this important task.